Windermere Peninsula Properties
30 NE Romance Hill Road
Belfair, WA 98524

MIKE MOSTYN, CRS
E - Mostyn@Windermere.com
W - www.mikemostyn.com
S - www.BelfairWindermere.com
WA. License #106546
The South Sounder is an annual Washington State-based newsletter sent in April to every owner of Mason County waterfront property on Puget Sound.
For those who don't get the newsletter or find the Internet more convenient, this website has been created.
Thank you for your interest. If you have any questions, comments or suggestions, feel free to contact me.

The data used to create these charts was collected from actual MLS records of saltwater residential sales in 2017 excluding manufactured homes, condominiums and land sales were NOT included to provide a more accurate picture of residential averages. NOTE: If a waterfront home was “sold by owner”, it was not documented by Northwest Multiple Listings Service and is not accounted for in these calculations.
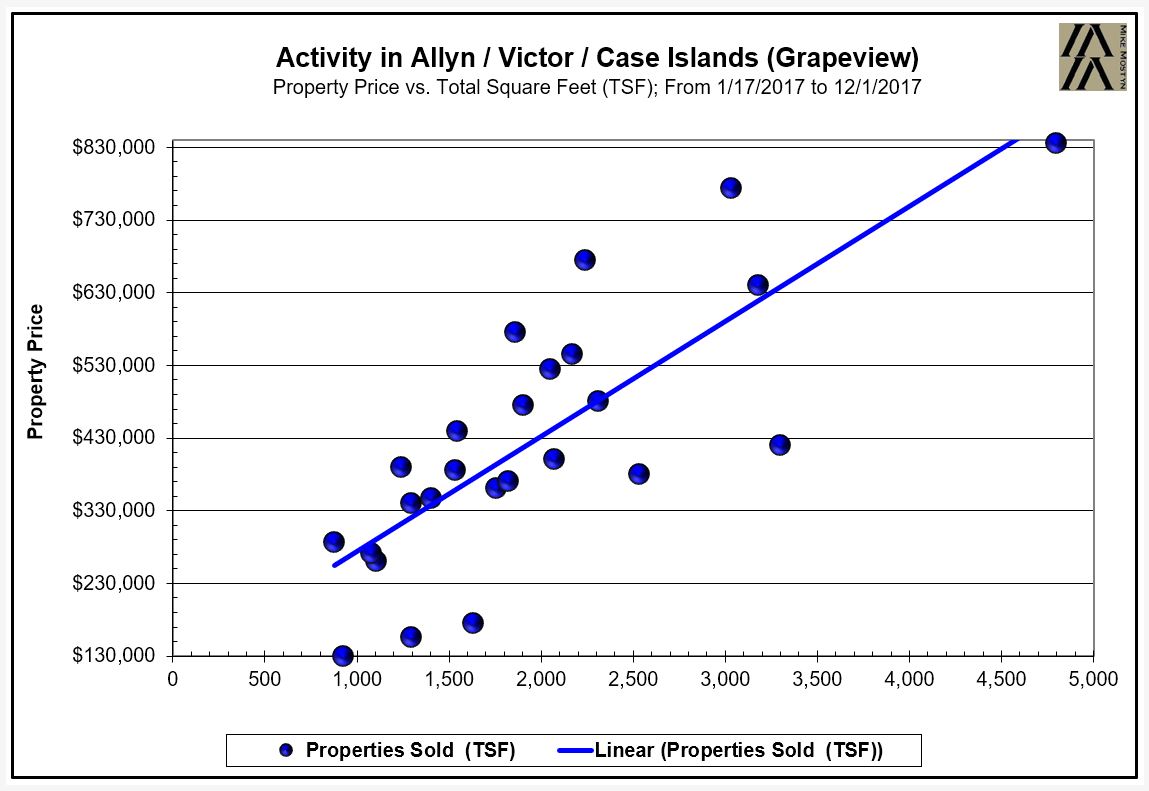
Each dot on this chart is an actual waterfront home sale. Each dot is placed on this chart by its price and total finished square footage. A mathematic average is than calculated from these sales to create a line. That line is the average sale price at any one size of home. Where the line crosses the square footage marker is an average home sold at an average price. By comparing like-size homes in different areas, you get a sense of the relative prices of any one beach.
For example, an average 2000 square foot home on Bainbridge Island cost an average of $1.2 million while the same 2000 square foot home on Hood Canal was $510,000. This is the cost difference for a 15-minute shorter ferry ride from Seattle.
NOTE: You can also determine how much deviation there is from the average condition of homes by the number of dots above and below the line.

The price per square foot of waterfront homes fluctuates during the year – cheaper in the winter, more expensive during the summer. An accurate comparison of prices must account for these fluctuations and 2017 is the last full year on record. To illustrate the general fluctuation of South Puget Sound waterfront property, here is the 2017 month-by-month price per square foot of waterfront residential prices in the counties of Pierce, Kitsap, Mason and Thurston combined – a difference of $56 depending upon when a home is bought.

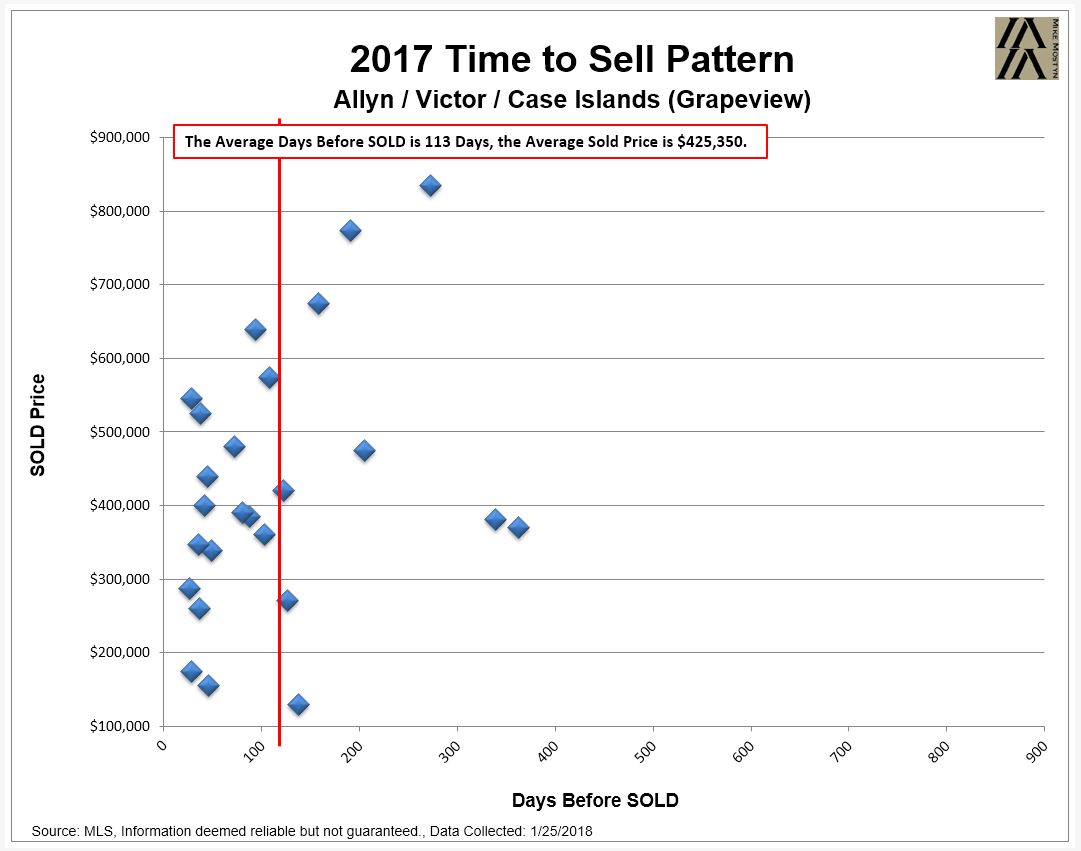
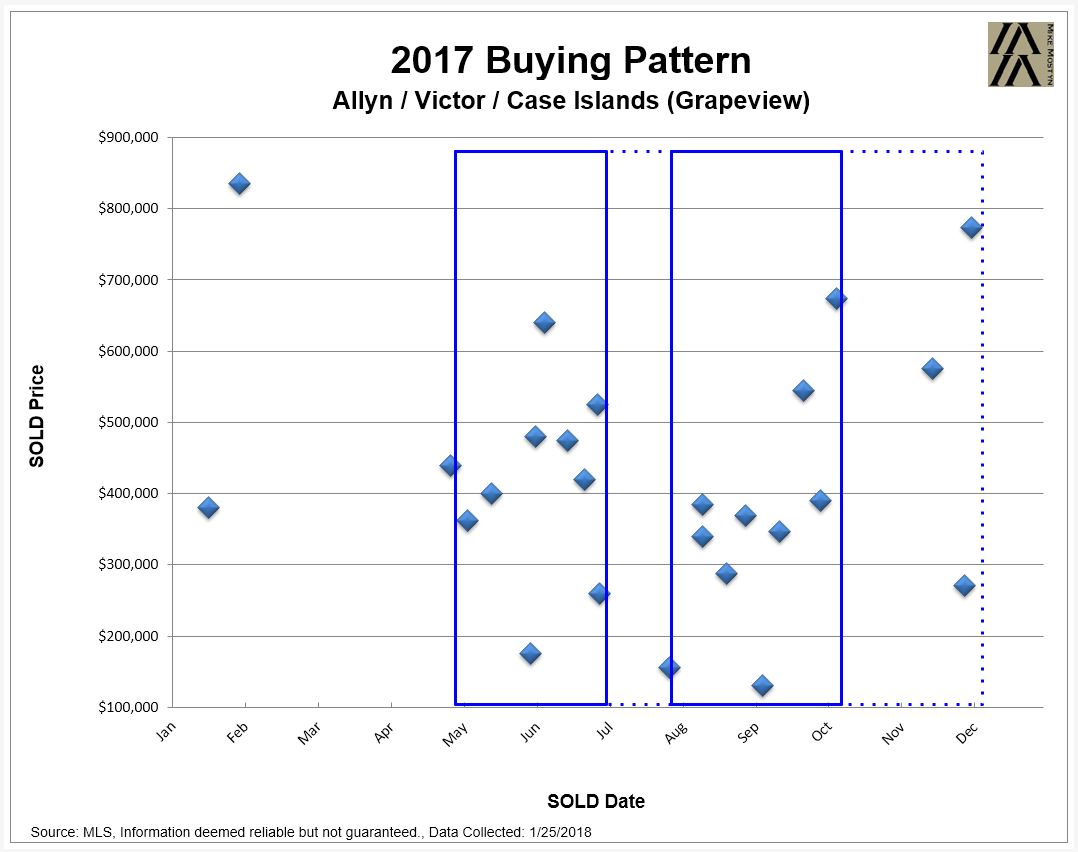
The answer: By working backwards. First, you must know the area’s buying pattern – when do buyers purchase homes in this area? Move back 45 days (average time for escrow) from the first month of “buying season” and you are close.

This is the “Buying Pattern” chart for this area, each dot is an actual sale as marked by the day it closed. REMEMBER: an average of 45 days is needed for a sale to be completed. This process is generally called “escrow.” For example, a home “sold” in June may have been negotiated in April or May.

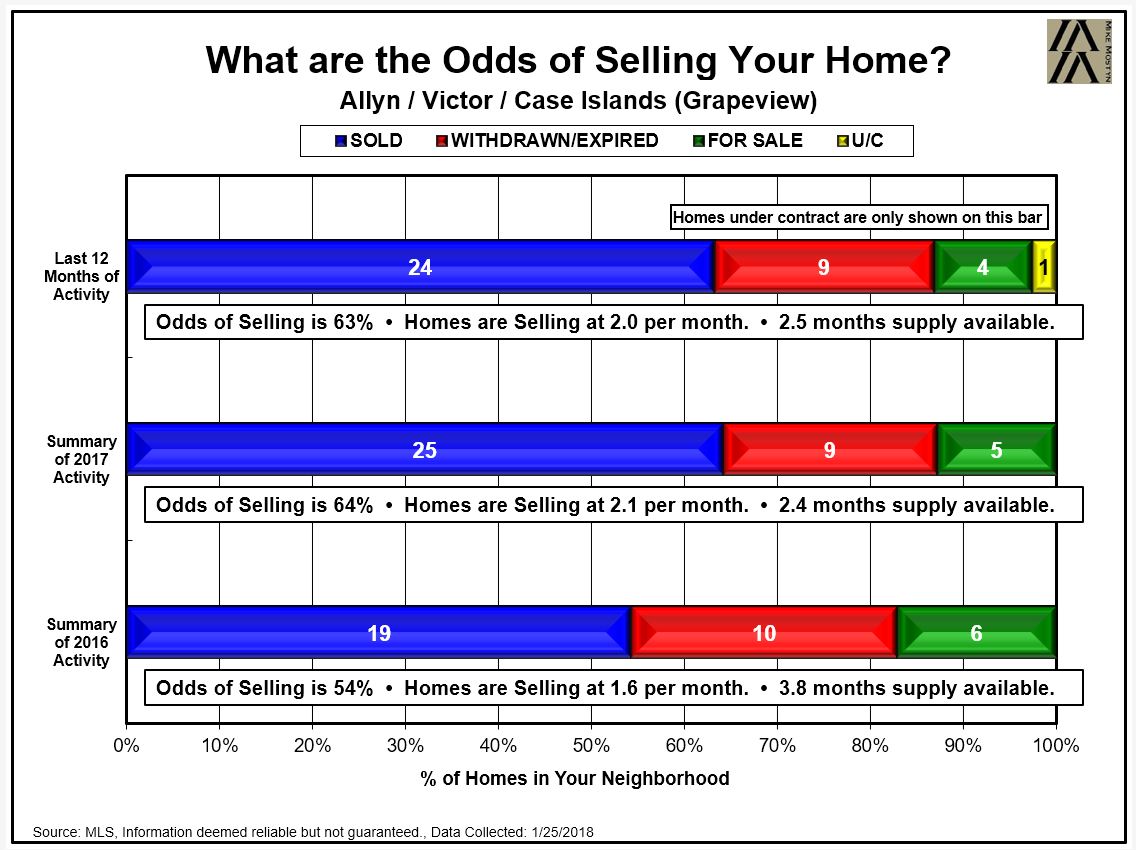
One measure is to examine the listing success or the “Odds of Selling”. Generally, a property doesn’t sell because of price – i.e. priced too high for its condition. By knowing how many homes were for sale compared with how many actually sold, you get a sense of overall demand. Also important is why a property didn’t sell – did the listing expired or was it cancelled early within its listing contract?
While any property can be priced too high and not sell, overall differences in the “Odds of Selling” between areas suggest the nature of the year’s demand.
